

A common challenge for organisations going through a technology transformation is how to measure progress and the impact of the new capabilities on business outcomes. In other words, how do you make measurement more data-driven rather than relying on anecdotes like, “yeah, we feel things are improving.”
A sensemaking mechanism is vital for leadership teams to understand whether the organisation is improving its software delivery performance. It also works as a catalyst to increase the investment capacity in the transformation program.
This article is intended to provoke thoughts around performance data science and how to nurture a data-driven culture. It’s not a definitive guide or a set of recommendations.
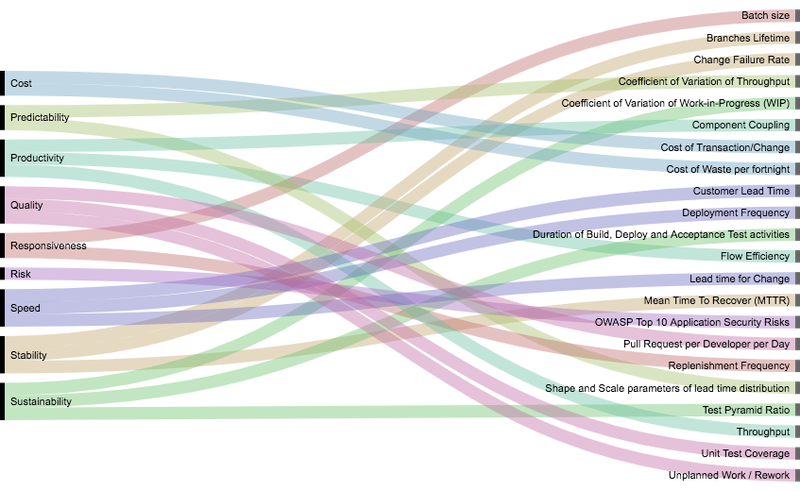
The picture below shows nine business dimensions: speed, stability, predictability, productivity, sustainability, quality, risk, responsiveness, and cost. These dimensions have a few metrics that can be used like building blocks to construct your transformation dashboard.
I’m now going to navigate across each of them and provide some actionable insights.
1. Speed
Customer lead time
This is the time between a customer order being accepted and delivered. A customer could be both internal and external and the order, for example, could be your feature or user stories. The lead time shows your ability to complete end-to-end work that matters to your customer. If you can measure only one thing, measure lead time.
Lead time for change
This shows how effective your change management process is, going from code commit to production. High performers do everything needed in less than one hour. That’s 440 times faster than their low performing peers. A cumbersome process to release changes (e.g. CAB meetings, later integration and manual testing) increases the cost of transaction, consequently increasing batch size, killing business responsiveness. This is lean product development 101.
Deployment frequency
This is how frequently you deploy software into production. High performers have decoupled deployment from release. They are deploying into production multiple times per day. Research shows they are deploying software 46 times more frequently than their low performing peers.
Although it’s a vanity metric, your deployment frequency is a leading indicator of how smooth your path to production is (small batches, mature CI/CD practices, effective change management, etc.).
2. Predictability
Coefficient of variation of throughput
A predictable software delivery team will have low variability in throughput and lead time. Delivering none and then a lot, and then none and then a lot is not good. This disruptive variability is harmful to both business and IT.
Shape and scale parameters of lead time distribution
Lead time distributions of knowledge work are exponential distributions, instead of normal distributions. To understand predictability of lead time, we use the Weibull Shape Parameter (healthy range between 1-2) and the Weibull Scale Parameter (healthy range between 0-10).
3. Risk
OWASP Top 10 application security risks
The Open Web Application Security Project (OWASP) is an open community dedicated to enabling trust in applications and APIs. Risks are rated by severity (technical impact) and likelihood. You probably should have an improvement driver to eradicate high-severe and critical exposures from your portfolio.
4. Sustainability
Coefficient of variation of work-in-progress (WIP)
The 8th Principle of the Agile Manifesto suggests that teams should be able to maintain a constant pace indefinitely. High WIP reduces quality and increases lead time and burnout. Teams need to find an optimum amount of WIP and maintain the flow. My empirical observation suggests that a healthy range for the WIP CV is between 30 per cent and 70 per cent.
Duration of build, deploy and acceptance test activities
The length of these activities is a leading indicator of your teams’ ability to maintain a sustainable pace. Define the target duration for each activity that makes sense for your unique context and create an improvement driver to meet these targets. Once met, determine a healthy range for these durations and let them operate without intervention within these ranges.
Test pyramid ratio
The shape of your test pyramid is another leading indicator of sustainability. Aim for a large base, typically 70 per cent of unit tests, providing fast and cheap feedback. Around 20 per cent of integration tests and 10 per cent of end-to-end tests on top of that, including the exploratory tests.
Join the CIO Australia group on LinkedIn. The group is open to CIOs, IT Directors, COOs, CTOs and senior IT managers.